Useful Links and Information:
Before the trip:
- Final Information Letter (June 2017) - HERE
- Suggested kit list - HERE
- SV 7 Medical and Permission form - HERE
For use on the field trip:
Study Packs - Students should download and print a copy.
Study Packs - Students should download and print a copy.
The following report is what you need to use to revise and prepare for exams. Sample practice questions are included at the end.
DNO @5th Feb 2018
Field work report for Day 1 - HERE (This is the report used in the PSHE additional Geog sessions)
12th June 2017
Introductory Lesson 1:
Presentation/Slide Share - HERE
Slides 1 to 18
Aims:
To know the location of the field study, to introduce the enquiry concept and to practice developing basic enquiry questions.
Prep. Session re Day 1
Field work principles:
- Choice of location
- Enquiry process/pathway

Prep. Session re Day 1 (continued)
Field techniques - Data collection:
Qualitative - data that is not numerical such as illustrations, site descriptions or some types of interview responses are called “Qualitative” data.
Quantitative - for fieldwork enquiries, we often collect data in number form called “Quantitative” data. This is useful for producing graphs and carrying out statistical analyses. An example of quantitative data could be the average size of beach pebbles in different locations used to determine whether the beach material has been sorted by the action of waves. Q. What type of method is drawing a Field Sketch?
Other classifications of Data... Data is Information...
Primary Data:
This is fieldwork data which you collect yourself… it is “first-hand” information that comes from you and the people you have worked with.
Secondary Data:
Secondary data is information that another person or group has collected. Such data can provide valuable background and context for your enquiry. It helps you to understand more about the places and kinds of questions that might be appropriate for the enquiry. The geology of the cliffs making up the coast, for example, is secondary data and would help you to understand why some areas erode more quickly than others.
There are lots of secondary data in your study packs.
Look at the geology map below... Primary or secondary? Qualitative of Quantitative?
Can you use the information from it to add labels about the geology of Durdle Door to your "field sketch"...
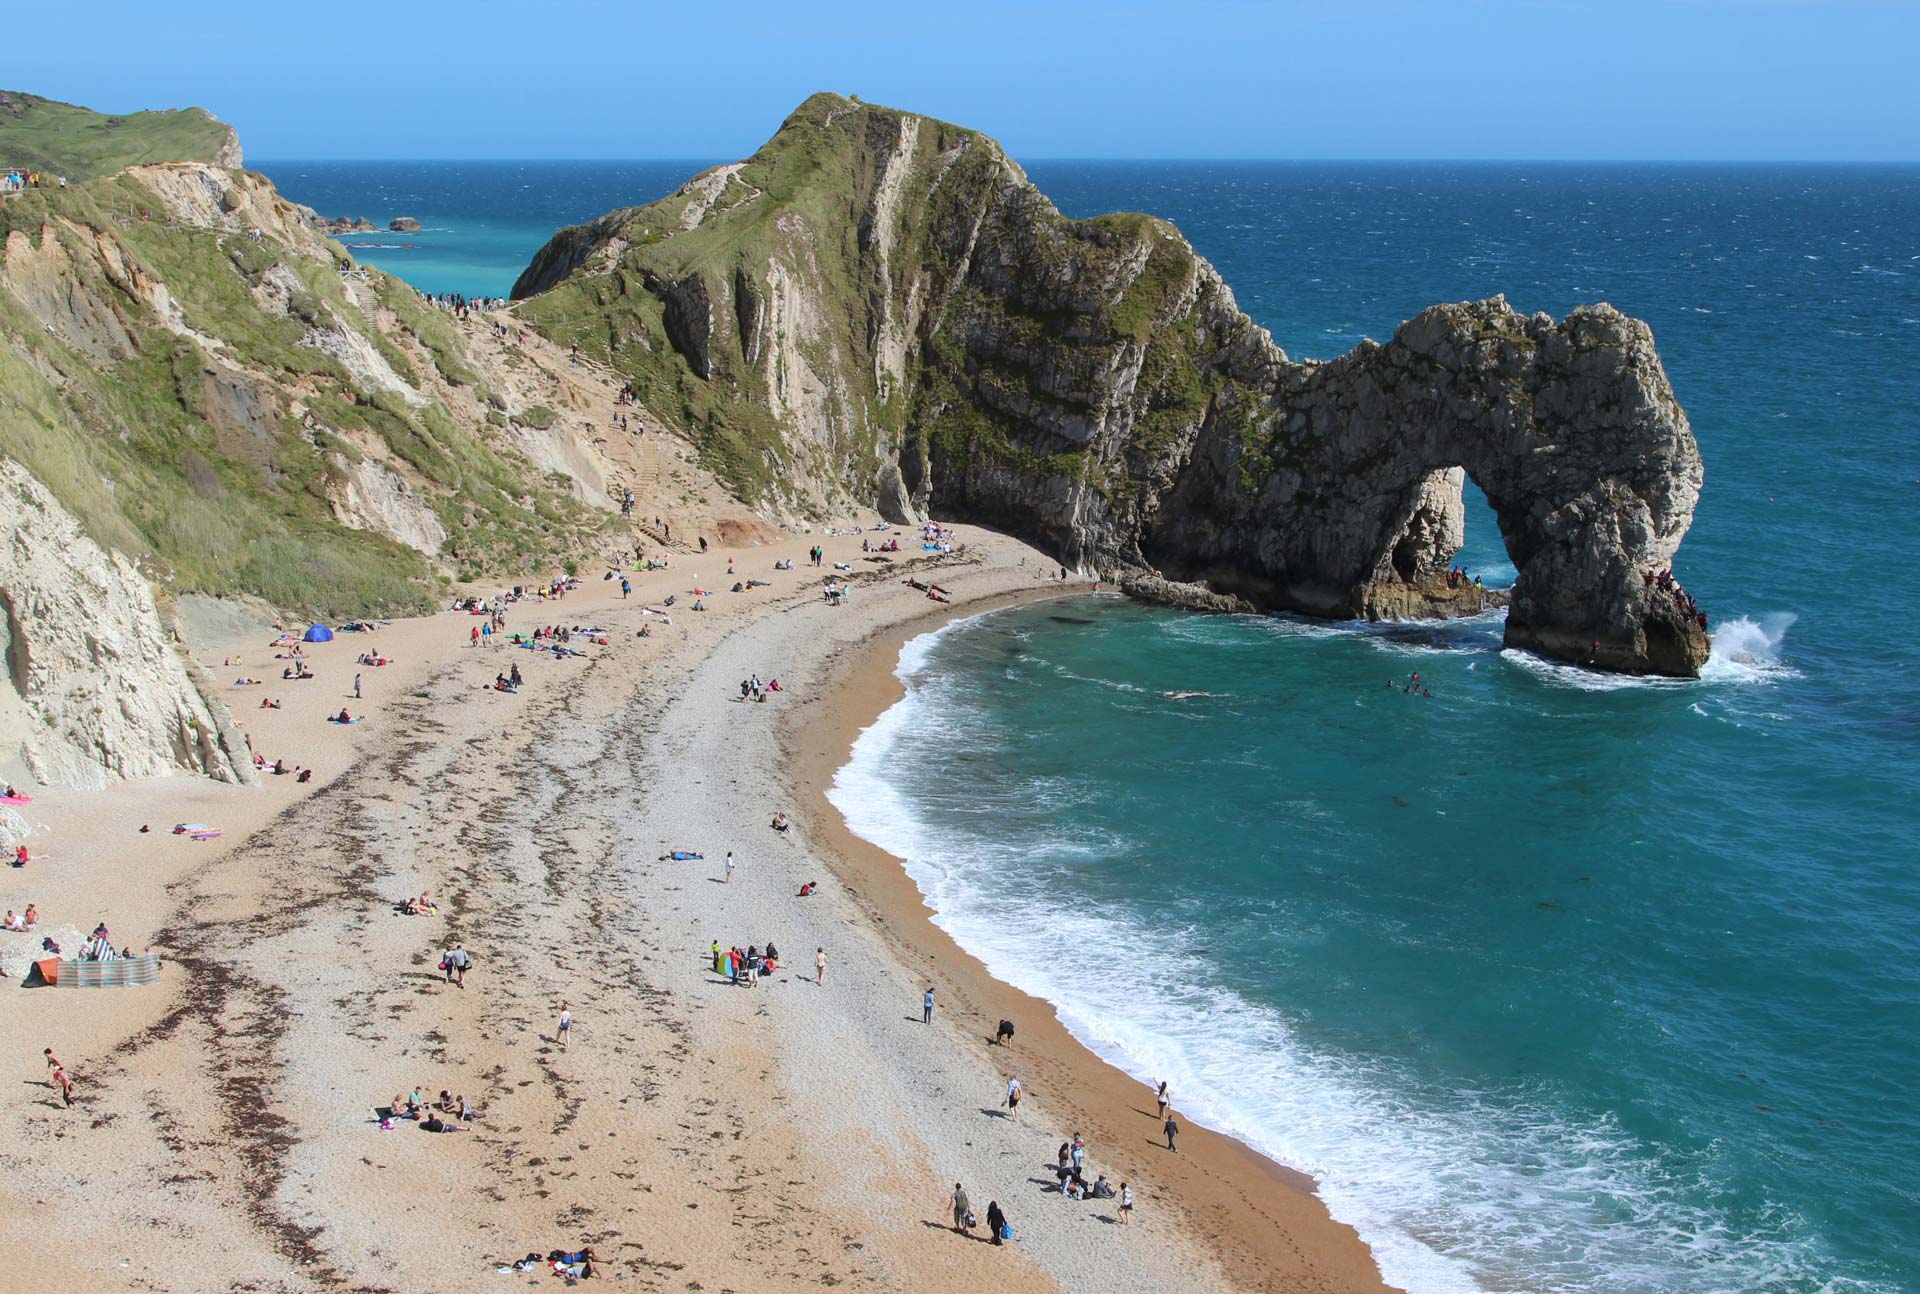
Processes at Durdle Door?
What processes can we see evidence of eg in the photo/on your sketches?
What about Transportation... what questions do you think we could ask about that and how might we investigate?
Consider:
- Transportation across the beach from Swash zone to cliffs... berms and storm beaches.
- Along the beach... Long shore drift?
Preparation for site visits
- Key enquiry questions
- Data collection techniques (Quantitative/Qualitative)
- Method – written up in detail
- Explore any issues that might influence the reliability of their results.
Day 2/Survey B:
Bi-Polar Survey – measuring the effectiveness of coastal defences
1. As you come across a type of coastal defense, add it to the table below
(This table is used to design a KEY to the different types of coastal defense present on the beach - See 2 below)
2. Create a symbol or initial for the defense (e.g. # or SW for Sea Wall)
2. Create a symbol or initial for the defense (e.g. # or SW for Sea Wall)
Symbol / Initial
|
Type of defense:
|
Symbol / Initial
|
Type of defence:
|
Gr
|
Groyne
| ||
Sw
|
Sea Wall
| ||
3. Using this symbol, complete the bi-polar chart – scoring each defense in each category.
(This table allows you to assess the effectiveness of each type of coastal defense based on how much it costs, what would happen without it and how long it will last and its appearance. Note, you can use some of the information from the Ranking Table to assist you in deciding the score of each type of defense)
Bi-Polar Chart
|
-3
|
-2
|
-1
|
0
|
1
|
2
|
3
| ||
Cost
|
Expensive
|
Sw
|
Cheap
| ||||||
Life span
|
Short Lived
|
Sw
|
Long lasting
| ||||||
Appearance
|
Ugly
|
Sw
|
Attractive
| ||||||
Effectiveness
|
Ineffective
|
Sw
|
Effective
| ||||||
Impact on processes
|
Bad effects
|
Sw
|
Good/no effects
| ||||||
Impact if scheme fails
|
Large effect
|
Sw
|
Minor effect
| ||||||
When deciding on the score to give each defense method... are you making personal judgement or being scientific and objective? Is the data therefore qualitative or quantitative?
Try ranking the schemes: (e.g. 1 = best in category, 9 = worst in category (depending on the no. of schemes))
Scheme
|
Cost
|
Life span
|
Appearance
|
Effectiveness
|
Impacts (processes)
|
Impacts
(if fails) |
Total Score
|
Groynes
|
£10, 000 each
|
30-40 years
| |||||
Sandstone Boulders
|
Transport & installation
|
20 years (approx)
| |||||
Shingle ridge
|
Free (natural)
|
Fluctuates
| |||||
Sea Wall
|
£6,000 per metre
|
50+ years
| |||||
Cliff wall
|
£2,000 per metre
|
15 years (collapse)
| |||||
Gabions
|
£100 per metre
|
Less than 10 years
| |||||
Vegetation matting
|
Low cost
|
Slumps prone to loss
| |||||
Jetty
|
£200, 000 total
|
50+ years
| |||||
Beach Recharge
|
£2m
|
70 years
|
If a method gained a high value score... what would that mean in terms of its effectiveness?
4. Using the same symbols, complete the map to show where the different types of coastal management approach are located on Swanage Beach.
(In addition to giving geographical information about the location of the methods of coastal defense, mapping may also reveal patterns in the distribution of different methods. These patterns might help us to understand why certain methods have been used in preference to others)

Field Study - Day 1
Although arrived a little late at West Lulworth due to traffic and minor incident between the coach and a van... groups set to field sketching and sketch mapping. As many had already completed photo "field sketch"of DD, concentrated on the view toward the west which takes in Bat Hole, stack, stumps and the cave/wcn along the bottom of the chalk cliffs. The beach also has a number of berms and a storm beach present (although these are not continuous... more in some parts than in others).
Completion of sampling generally effective although one or two weaknesses evident. Unfortunately limited time in evening session to explore these. However, we can concentrate a bit more on thttps://docs.google.com/document/d/1VPNqIVIQg9WVhHRE51Czscsz-ncNi8FzuNxnnZVwn0o/edit?usp=sharinghis aspect after tomorrow. Today is about the processes involved in collecting qualitative and quantitative data as well as collation, presentation and a little evaluation of these.
Presentations at the end reveal that the pattern of sediment sizes is not as might have been expected (as was observable on the beach)... Larger material is located toward the east overall and there tended to be bigger material in depressions behind berms and on tops of berms/ridges. The sediments did not appear to be simply distributed according to size across the beach.
Why?
Possible factors at play...
- Accumulation and entrappment of sediment at end of beach.
- Elevation of beach to the east reduces the effect of wave action (less attrition)
- Source and type of rocks... grey and larger materials may be flints from the chalk... hard and recent additions to beach... less susceptible to attrition. Other (orange) material/gravel pebbles may originate from the Flandrian Transgression and thus have been subject to much more erosion and transportation. Orange sediments was markedly smaller than the grey. Note: bands of angular flint evident throughout the chalk cliffs.
- Accumulation in depressions between ridges... again entrapment playing a role?
- Effect of the offshore reef formed by the limestones that have largely been breached and eroded (now forming stumps in places eg the calf, cow and bull).
No comments:
Post a Comment
Note: only a member of this blog may post a comment.